Sling Models offer a very convenient abstraction, as they allow data from the repository being mapped into fields of Java POJO classes. One feature I find often used is the optional InjectionStrategy. By default if an injection is not working, the instantiation of the POJO fails. When the InjectionStrategy.OPTIONAL field is set in the model annotation (see the Sling docs), such a non-working injection will not fail the creation of the model, but instead the field is left with the default value of the respective type. Which is null for Strings and other complex types. And this setting is valid for the entire class, so when you want to write reliable code, you would have to assume that every injected String property could be null.
This comes with a few challenges, because now you can’t rely anymore on values being non-null, but you would need to test each field if a proper value has been provided. Which is sometimes done, but in the majority of cases it is just assumed, that the field is non-null.
I wonder, why this is done at all. Because normally you write your components in a way that the necessary properties are always available. And if you operate with defaults, you can guarantee with several ways that they are available as soon as the component is being created and authored for the very first time. And while for a few cases a missing property must be dealt with for whatever reason, it is never justified to treat all property injections as optional. Because that would mean, that this sling model is supposed to make sense of almost any resource it is adapted from. And that won’t work.
And if a property is really optional: we added some time back the feature to use something like this (if you really can’t give a default value, which would be a much better choice):
@ValueMapValue
Optional<String> textToDisplay;
With this you can express the optionality of this value with the Java type system, and in that case it’s quite unlikely to miss the validation.
But if it would be just be up to me, I would deprecate InjectionStrategy.OPTIONAL and ban it, because it’s one of the most frequent reasons for NullPointer exceptions in AEM.
I know that using InjectionStrategy.OPTIONAL saves you from asking yourself “is this property always present?”, but that’s a very poor excuse. Because with just a few more seconds of work you can make your Sling Model more robust by just providing default values for every injected field. So please:
Avoid using optional injections when possible!
When it’s required use the Optional type to express it!
Don’t use InjectionStrategy.OPTIONAL!
Using “optional” (in all cases) can also come with a performance impact when used with the generic @Inject annotation; for that read my earlier blog posts on the performance of Sling Models: Sling Model Performance.
When there’s a topic which has been challenging forever in the AEM world, then it’s JCR queries and indexes. It can feel like an arcane science, where it’s quite easy to mess up and end up with a slow query. I learned it also the hard way, and a printout of the JCR query cheatsheet is always below my keyboard.
But there were some recent changes, which made the work with query performance easier. First, in AEM CS the Explain Query tool has been added, which is also available via the AEM Developer Console. It displays queries, slow queries, number of rows read, the used index, execution plan etc. But even with that tool alone it’s still hard to understand what makes a query performant or slow.
Last week there was a larger update to the AEM documentation (thanks a lot, Tom!), which added a detailed explanation of the Explain Query tool. Especially it drills down into the details of the query execution plan and how to interpret it.
With this information and the good examples given there you should be able to analyze the query plan of your queries and optimize the indexes and queries before you execute them the first time in production.
Errors and problems in running software manifest often in very interesting and non-obvious cases. A problem in location A manifests itself only with an unrelated error message in a different location B.
We also have one example of such a situation in AEM, and that’s the famous “Authentication support missing” error message. I see often the question “I got this error message; what should I do now?”, and so I decided: It’s time to write a blog post about it. Here you are.
“Authentication support missing” is actually not even correct: There is no authentication module available, so you cannot authenticate. But in 99,99% of the cases this is just a symptom. Because the default AEM authentication depends on a running SlingRepository service. And a running Sling repository has a number of dependencies itself.
I want to highlight 2 of these dependencies, because they tend to cause problems most often: The Oak repository and the RepositoryInitializer service. Both must be up and be started/run succesfully until the SlingRepository service is being registered succesfully. Let’s look into each of these dependencies.
The Oak repository
The Oak repository is a quite complex system in itself, and there are many reasons why it did not start. To name a few:
Consistency problems with the repository files on disk (for whatever reasons), permission problems on the filesystem, full disks, …
Connectivity issues towards the storage (especially if you use a database or mongodb as storage)
Messed up configuration
If you have an “authentication support missing” message, you first check should be on the Oak repository, typically reachable in the AEM error.log. If you have an ERROR messages logged by any “org.apache.jackrabbit.oak” class during the startup, this is most likely the culprit. Investigate from there.
Sling Repository Initializer (a.k.a. “repoinit”)
Repoinit is designed to ensure that a certain structure in the repository is provided, even before any consumer is accessing it. All of the available scripts must be executed, and any failure will immediate terminate the startup of the SlingRepositoryService. Check also my latest blog post on Sling Repository Initializer for details how to prevent such problems.
Repoinit failures are typically quite prominent in the AEM error.log, just search for an ERROR message starting with this:
*ERROR* [Apache SlingRepositoryStartup Thread #1] com.adobe.granite.repository.impl.SlingRepositoryManager Exception in a SlingRepositoryInitializer, SlingRepositoryservice registration aborted …
These are 2 biggest contributors to this “Authentication support missing” error messages. Of course there are more reasons why it could appear. But to be honest, I only have seen these 2 cases in the last years.
I hope that this article helps you to investigate such situations more swiftly.
I randomly see the question “We get the TooManyCallsException while rendering pages, and we need to increase the threshold for the number of inclusions to 5000. Is this a problem? What can we do so we don’t run into this issue at all?”
Before I answer this question, I want to explain the background of this setting, why it was introduced and when such a “Call” is made.
Sling rendering is based on Servlets; and while a single servlet can handle the rendering of the complete response body, that is not that common in AEM. AEM pages normally consistent of a variety of different components, which internally can consist of distinct subcomponents as well. This depends on the design approach the development team has choosen. (It should be mentioned that all JSPs and all HTL scripts are compiled into regular Java servlets.)
That means that the rendering process can be considered as tree of servlets, and servlets calling other servlets (with the DefaultGetServlet being the root of such a tree when rendering pages). This tree is structured along the resource tree of the page, but it can include servlets which are rendering content from different areas of the repository; for example when dealing with content fragments or including images, which require their metadata to be respected.
It is possible to turn this tree into a cyclic graph; and that means that the process of traversing this tree of servlets will turn into a recursion. In that case request processing will never terminate, the Jetty thread pool will quickly fill up to its limit, and the system will get unavailable. To avoid this situation only a limited number of servlet-calls per request is allowed. And that’s this magic number of 1000 allowed calls (which is configured in the Sling Main Servlet).
Knowing this let me try to answer the question “Is it safe to increase this value of 1000 to 5000?“. Yes, it is safe. In case your page rendering process goes recursive it terminates later, which will increase a bit the risk of your AEM instance getting unavailable.
“Are there any drawbacks? Why is the default 1000 and not 5000 (or 10000 or any higher value)?” From experience 1000 is sufficient for the majority of applications. It might be too low for applications where the components are designed very granular which in turn require a lot of servlet calls to properly render a page. And every servlet call comes with a small overhead (mostly for running the component-level filters); and even if this overhead is just 100 microseconds, 1000 invocations are 100 ms just for the invocation overhead. That means you should find a good balance between a clean application modularization and the runtime performance overhead of it.
Which leads to the next question: “What are the problematic calls we should think of?“. Good one. From a high-level view of AEM page renderings, you cannot avoid the servlet-calls which render the components. That means that you as an AEM application developer cannot influence the overall page rendering process, but you can only try to optimise the rendering of individual (custom) components. To optimise these, you should be aware, that the following things trigger the invocation of a servlet during page rendering:
the <cq:include>, <sling:include> and <sling:forward> JSP tags
the data-sly-include statement of HTL
and every method which invokes directly or indirectly the service() method of a servlet.
A good way to check this for some pages is the “Recent requests” functionality of the OSGI Webconsole.
During some recent work on performance improvements in request processing I used a tool, which is part of AEM for a very long time now; I cannot recall a time when it was NOT there. It’s very simple, but nevertheless powerful and it can help you to understand the processing of requests in AEM much better.
I am talking about the “Recent Requests Console” in the OSGI webconsole, which is a gem in the “AEM performance tuning” toolbox.
In this blog post I use this tool to explain the details of the request rendering process of AEM. You can find the detailed description of this process in the pages linked from this page (Sling documentation).
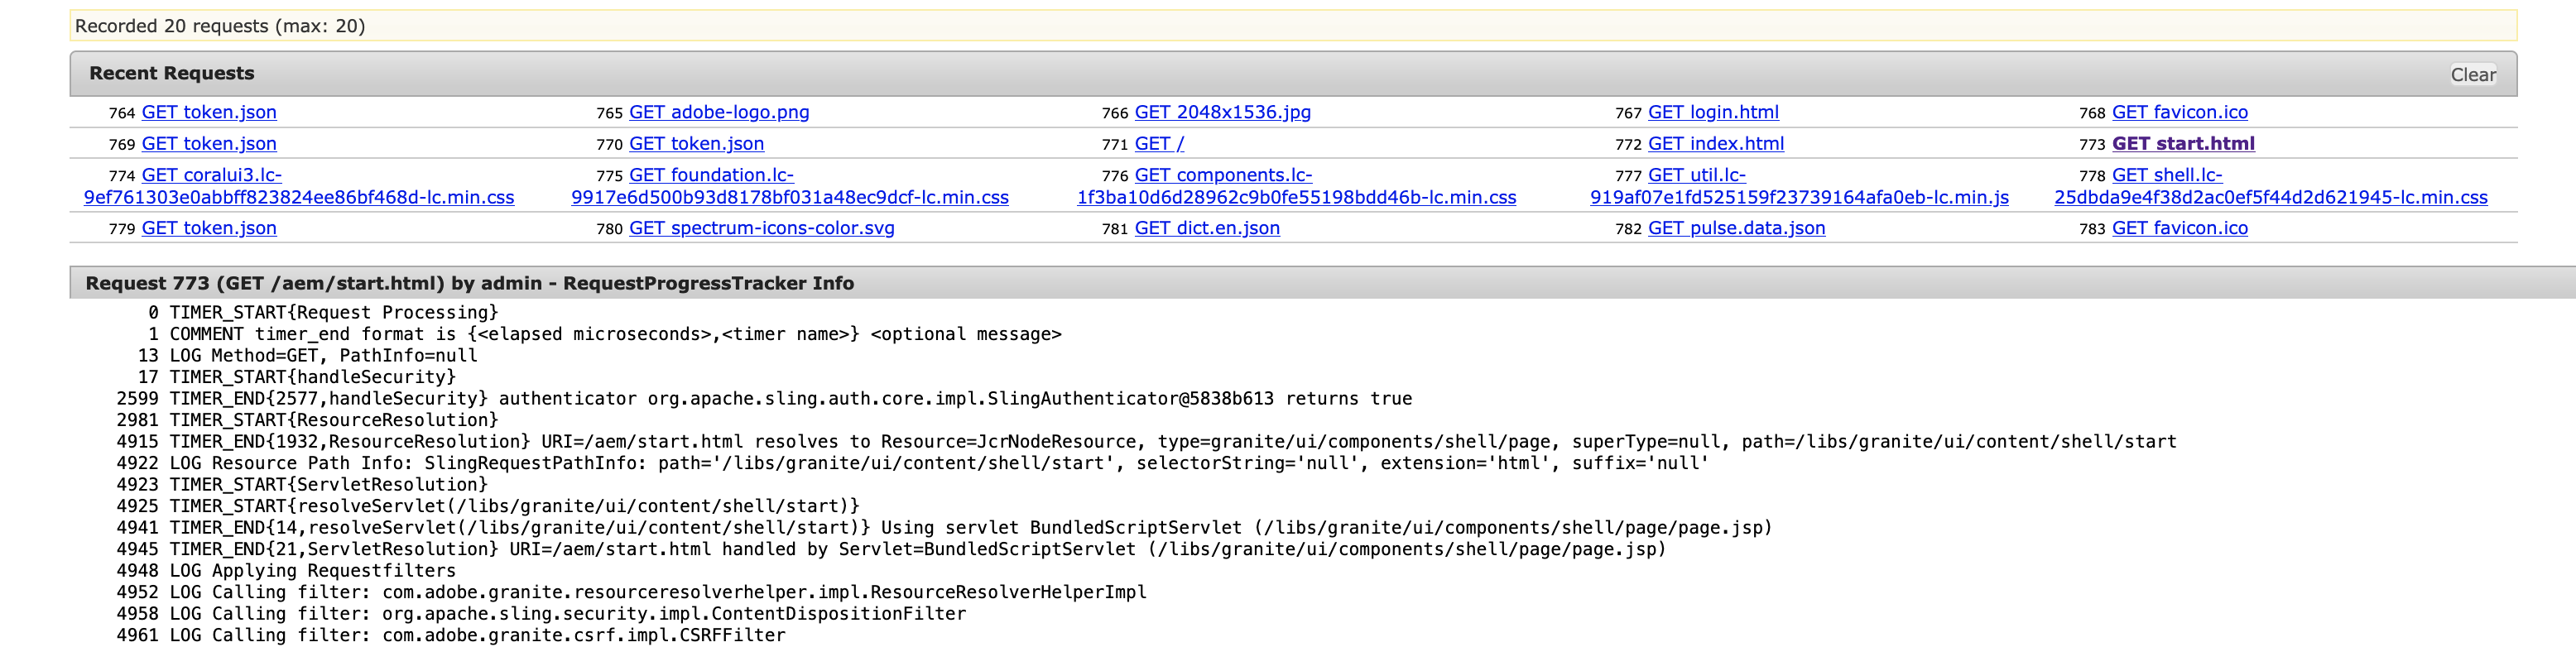
Screenshot “Recent requests”
With this Recent Requests screen (goto /system/console/requests) you can drill down into the rendering process of the last 20 requests handled by this AEM instance; these are listed at the top of the screen. Be aware that if you have a lot of concurrent requests you might often miss the request you are looking for, so if you really rely on it, you should increase the number of requests which are retained. This can be done via the OSGI configuration of the Sling Main Servlet.
When you have opened a request, you will see a huge number of single log entries. Each log entry contains as first element a timestamp (in microseconds, 1000 microseconds = 1 millisecond) relative to the start of the request. With this information you can easily calculate how much time passed between 2 entries.
And each request has a typical structure, so let’s go through it using the AEM Start page (/aem/start.html). So just use a different browser window and request that page. Then check back on the “Recent requests console” and select the “start.html”. In the following I will go through the lines, starting from the top.
Here we see the 2 log lines for a the resolving process of a resourcetype. It took 1932 microseconds to map the request “/aem/start.html” to the resourcetype “granite/core/components/login” with the path being /libs/granite/ui/content/shell/start. Additionally we see information about the selector, extension and suffix elements.
  4923 TIMER_START{ServletResolution}
   4925 TIMER_START{resolveServlet(/libs/granite/ui/content/shell/start)}
   4941 TIMER_END{14,resolveServlet(/libs/granite/ui/content/shell/start)} Using servlet BundledScriptServlet (/libs/granite/ui/components/shell/page/page.jsp)
   4945 TIMER_END{21,ServletResolution} URI=/aem/start.html handled by Servlet=BundledScriptServlet (/libs/granite/ui/components/shell/page/page.jsp)
That’s a nested servlet resolution, which takes 14 respective 21 microseconds. Till now that’s mostly standard and hard to influence performance-wise. But it already gives you a lot information, especially regarding the resourcetype which is managing the complete response processing.
These are all request-level filters, which are executed just once per request.
And now the interesting part starts: the rendering of the page itself. The building blocks are called “components” (that term is probably familiar to you) and it always follows the same pattern:
Calling Component Filters
Executing the Component
Return from the Component Filters (in reverse order of the calling)
This pattern can be clearly seen in the output, but most often it is more complicated because many components include other components, and so you end up in a tree of components being rendered.
As an example for the straight forward case we can take the “head” component of the page:
At the top you see the LOG statement “Including resource …” which provides you with the information what resource is rendered, including additional information like selector, extension and suffix.
As next statement we have the resolution of the renderscript which is used to render this resource, plus the time it took (40 microseconds).
Then we have the invocation of all component filters, the execution of the render script itself, which is using a TIMER to record start time, end time and duration (18576 microseconds), and the unwinding of the component filters.
If you use a recent version of the SDK for AEM as a Cloud Service, all timestamps are in microseconds, but in AEM 6.5 and older the duration measured for the Filters (inner=…, outer=…) were printed in miliseconds (which is an inconsistency I just fixed recently).
If a component includes another component, it looks like this:
You see the component filters, but then after the TIMER_START for the page.jsp (check the trailing timer number: #0, every timer has a unique ID!) line you see the inclusion of a new resource. For this again the render script is resolved and instead of the ComponentFilters the IncludeFilters are called, but in the majority of cases the list of filters are identical. And depending on the resource structure and the script, the rendering tree can get really deep. But eventually you can see that the the rendering of the page.jsp is completed; you can easily find it by looking for the respective timer ID.
Equipped with this knowledge you can now easily dig into the page rendering process and see which resources and resource types are part of the rendering process of a page. And if you are interested in the bottlenecks of the page rendering process you can check the TIMER_END lines which both include the rendering script plus the time in microseconds it took to render it (be aware, that this time also includes it too to render all scripts invoked from this render script).
But the really cool part is that this is extensible. Via the RequestProgressTracker you can easily write your own LOG statements, start timers etc. So if you want to debug requests to better understand the timing, you can easily use something like this:
And then you can find this log message in this screen when this component is rendered. You can use it to output useful (debugging) information or just have use its timestamp to identify performance problems. This can be superior to normal logging (to a logfile), becaus you can leave these statements in production code, and they won’t pollute the log files. You just need to have access to the OSGI webconsole, search for the request you are interested and check the rendering process.
And if you are interested, you can can also get all entries in this screen and do whatever you like. For example you can write a (request-level) filter, which calls first the next filter, and afterwards logs all entries of the RequestProgressTracker to the logfile, if the request processing took more than 1 second.
The Request Progress Tracker plus the “Recent Requests” Screen of the OSGI webconsole are a really cool combination to both help you to understand the inner working of the Sling Request Processing, and it’s also a huge help to analyze and understand the performance of request processing.
I hope that this technical deep dive into the sling page rendering process was helpful for you, and you are able to spot many interesting aspects of an AEM system just be using this tool. If you have questions, please leave me a comment below.
A recurring problem I see in AEM project implementations is the problem of missing abstraction. A lot of code deals passes around resources, ValueMaps and even Strings (paths). And because we are supposed to build software the proper way, the called method checks (or more often: not checks) that the provided resource parameter is not null, and that the resource is of the correct type.
But instead of dealing with resources, the class names and comments suggest that the code actually dealing with products. Or website structures. Or assets. But instead of using a “product” classes (or website class, or the provided asset class) still resources are used. The abstraction is missing!
For me the root cause of this problem is the CRXDE Lite. Exactly that thing which you can open on your local AEM instance at /crx/de/. Because it shows you a very nice hierarchical view to the repository, it shows you paths, and properties. And if a developer starts to build a mental model of something, this tool comes in quite handy. Because you can reach everything via path, which is a String! So instead of expressing relations between concepts I see often this:
is much easier to use (and did you spot the off-by-one bug in the String operation example? And what does happen if the path ends already with a slash?). But that still leaves the question, why you need to get the parent resource. Maybe a
is a more expressive way to describe the same. I would definitely prefer it.
So CRXDE is your biggest enemy when designing your application. If you are a seasoned AEM developer, my recommendation to you: Don’t explain your application with CRXDE. Rather use proper abstractions. Don’t do CRXDE driven development!
If that topic sounds familiar to you: I did a talk on the AdaptTo() conference 2020 regarding this topic, you can find the recording here. There I explain the problem in more detail, also including some better examples 🙂
Well, that result is not correct, because the example implementations of the SlingModels used there are not identical. Because in the case of field-based injection the references are available during the complete lifetime of that SlingModel, not just during the @PostConstruct method call, thus these references consume memory.
While with the example of constructor-based injection, the references are just available during the constructor call; they are not available in any other method. If you want to achieve the same behavior as in the field-injection example, you have to store the references in the global fields and then the memory consumption of that SlingModel increases.
But Justin Edelson pointed out correctly, that you gain from constructor-based injection, if you need the references just in the constructor to compute some results (which are then stored in fields), and in no other method. That’s indeed a small optimization.
But let’s be honest: If we are talking about an additional memory overhead of 100 bytes per a complex SlingModel, that’s a negligible number. Because it’s not typical that hundreds of these models are created per second. And even in that case, when they are created to render a page, the models are garbage collected immediately after when the request is completed. It doesn’t matter if 100 bytes more or less are allocated and collected. Thus the overhead is normally not even measurable.
But well, you might hit the edge case, where this really makes a difference.
Update June 8th: I got informed that the referenced blog article has been updated. It now contains a more reasonable example which makes the sling models comparable. Basically it reflects now the optimization Justin already mentioned. And the difference in object size is now only 40 bytes vs 24 bytes.
My colleague Jan Exner initiated a “no custom code challenge” for the Analytics area earlier this year; and in the followup of this the people of 33sticks posted a good summary why it would be much better if you could avoid any custom code in the analytics world.
I am wondering if this holds true for AEM systems as well. On the one hand side customization is required. For example you need to style the components according to the requirements and styleguides. But on the other hand siede, excessive customization (overlays and adaptions/changes to ootb functionality) leads to maintenance and upgrade issues. But maybe we should not use the term “customization” anymore in the AEM world, but choose a more appropriate one, maybe “application development on AEM”, because that’s what we do in reality quite often.
And the application development part is the one which makes software expensive. It requires design, architecture, implementors, tests, automated tests, deployments. It requires management and comes with risk. The more application development we have, the higher the risk and the costs.
If you were
able to avoid any application development in an AEM project, and just live with
the core components components and brand them accordingly, that would be great.
We would only focus on style and branding of the components, no need to Java
developers and code deployments. Just pure frontend, and a clever use of the
out-of-the-box tools AEM offers you.
I am truly convinced that you can build a standard marketing site (multi-site, multi-language, integrated translation etc) with this approach. It requires dicussion with the business and more important, you as a developer or architect need to urge yourself not write any code.
Of course, it’s probably getting a very basic site, but it can serve 2 purposes:
We identify what should really be part of AEM (which is something we can and should add asap)
We challenge ourselves to think in much simple structures and less customizations. I always wonder how easy the statement “then let’s overlay it” comes out of the mouth of an AEM consultant in a discussion, and I am no exception to this.
Yes, can we join Jan’s initiative. With AEM it’s definitely harder to achieve this than with other solutions of the Adobe Experience Cloud, but it’s doable. And honestly, we should accept such challenges more often. Even if we eventually fail.
Recently I
came across the AEM Developer Series posted by Anirudh Sharma at https://aem.redquark.org/2018/10/day-00-aem-developer-series.html;
it’s a great resource and gives you as a developer a good introduction what you
are likely to do when you want to start a career in AEM development.
Nevertheless,
this tutorial focusses purely on development tasks. This is a good approach
when you are a junior developer. If you are familiar with Java and assigned to
a project together with more senior and experienced developers and a good
architect, it’s a good start. Because in such a situation, you are told what to
do. Others do the relevant decisions like
Is this a new component? Or a variation of an existing component?
Should we create a new template or not?
Can we reuse or re-purpose an out-of-the-box feature of AEM? Or shoukd we create that on our own?
How do structure the content?
And many
questions more. And that is good, because you as a junior developer can learn a
lot from others.
But it has
one downside: You hardly known the product “AEM”, but are only
interested in extension points and APIs you can use. A good example is
Anirudh’s series I mentioned above: It just focusses on how to develop stuff,
on APIs which exist for years. Yes, that’s natural for a development course 🙂
But you as a
developer will never see what’s a already there! You are likely to ignore all the new feature
which have been added since AEM 6.0; sincet that time I see a shift in product
development from providing a framework towards more ready-to-use features.
For example the “projects” feature: There is much APIs, but most of that stuff is actually creating the right JCR structures. I see it rarely used. For many developers (people which are in the ecosystem for 10 years alike as for people just started; and ) the major and sometimes only concepts they use are pages, components and assets. Regarding Content Fragments and Experience Fragments the situation seems a bit better, maybe these have been communicated and marketed better. But whenever a new requirement is raised, the immedate reaction of an experienced developers often looks like this: How can we make this happen with pages, assets, components and dialogs? Instead of asking yourself “Is there something in product which we can reuse or customize?” This question should come up much more often. And yes, I am guilty as well.
Using new features, understanding their capabilities and their weaknesses should be as common to any more experienced AEM developer as knowing that you should close a ResourceResolver (sorry, couldn’t help myself :-))
So my recommendation to all of you who think of AEM 6.5 just as much more stable and performant AEM 5.6.1 with deprecated ClassicUI: It is, but also much more. Walk through the release notes and documentation, check for the new features, work with the tutorials and watch the videos. There are a lot of hidden gems which are good to know, and in the right situation it can be the solution to your development problem. Or at least help you to reduce effort. Just relying on the JCR API, Sling Resources, Servlets and the Edit mode might be absolutely future proof, but why do you use AEM then?
So for any
AEM junior developer: Next to your technical enablement: Try to understand
what’s in the product. Work with authors, test the user interface, check the
documentation; and maybe attend the user training. And be curious!


You must be logged in to post a comment.