During some recent work on performance improvements in request processing I used a tool, which is part of AEM for a very long time now; I cannot recall a time when it was NOT there. It’s very simple, but nevertheless powerful and it can help you to understand the processing of requests in AEM much better.
I am talking about the “Recent Requests Console” in the OSGI webconsole, which is a gem in the “AEM performance tuning” toolbox.
In this blog post I use this tool to explain the details of the request rendering process of AEM. You can find the detailed description of this process in the pages linked from this page (Sling documentation).
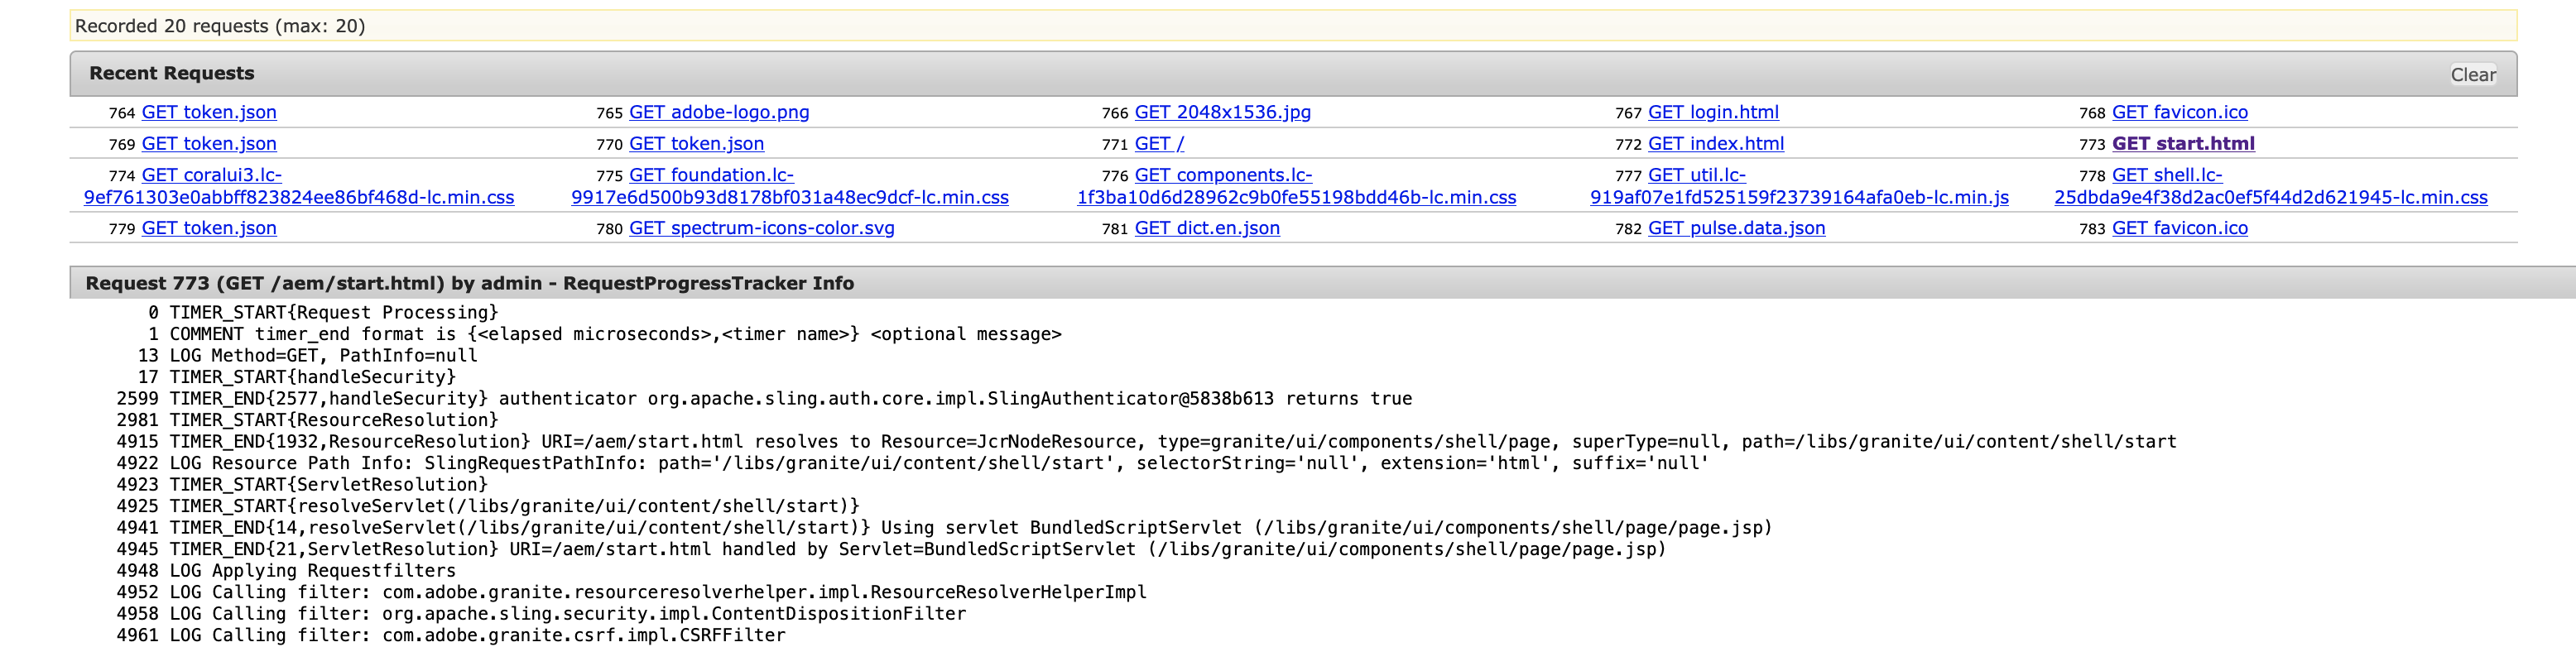
With this Recent Requests screen (goto /system/console/requests) you can drill down into the rendering process of the last 20 requests handled by this AEM instance; these are listed at the top of the screen. Be aware that if you have a lot of concurrent requests you might often miss the request you are looking for, so if you really rely on it, you should increase the number of requests which are retained. This can be done via the OSGI configuration of the Sling Main Servlet.
When you have opened a request, you will see a huge number of single log entries. Each log entry contains as first element a timestamp (in microseconds, 1000 microseconds = 1 millisecond) relative to the start of the request. With this information you can easily calculate how much time passed between 2 entries.
And each request has a typical structure, so let’s go through it using the AEM Start page (/aem/start.html). So just use a different browser window and request that page. Then check back on the “Recent requests console” and select the “start.html”.
In the following I will go through the lines, starting from the top.
      0 TIMER_START{Request Processing}
      1 COMMENT timer_end format is {<elapsed microseconds>,<timer name>} <optional message>
     13 LOG Method=GET, PathInfo=null
     17 TIMER_START{handleSecurity}
   2599 TIMER_END{2577,handleSecurity} authenticator org.apache.sling.auth.core.impl.SlingAuthenticator@5838b613 returns true
This is a standard header for each request. We can see here that the authentication took 2599 microseconds.
  2981 TIMER_START{ResourceResolution}
   4915 TIMER_END{1932,ResourceResolution} URI=/aem/start.html resolves to Resource=JcrNodeResource, type=granite/ui/components/shell/page, superType=null, path=/libs/granite/ui/content/shell/start
   4922 LOG Resource Path Info: SlingRequestPathInfo: path='granite/ui/components/shell/page', selectorString='null', extension='html', suffix='null'
Here we see the 2 log lines for a the resolving process of a resourcetype. It took 1932 microseconds to map the request “/aem/start.html” to the resourcetype “granite/core/components/login” with the path being /libs/granite/ui/content/shell/start. Additionally we see information about the selector, extension and suffix elements.
  4923 TIMER_START{ServletResolution}
   4925 TIMER_START{resolveServlet(/libs/granite/ui/content/shell/start)}
   4941 TIMER_END{14,resolveServlet(/libs/granite/ui/content/shell/start)} Using servlet BundledScriptServlet (/libs/granite/ui/components/shell/page/page.jsp)
   4945 TIMER_END{21,ServletResolution} URI=/aem/start.html handled by Servlet=BundledScriptServlet (/libs/granite/ui/components/shell/page/page.jsp)
That’s a nested servlet resolution, which takes 14 respective 21 microseconds. Till now that’s mostly standard and hard to influence performance-wise. But it already gives you a lot information, especially regarding the resourcetype which is managing the complete response processing.
4948 LOG Applying Requestfilters
 4952 LOG Calling filter: com.adobe.granite.resourceresolverhelper.impl.ResourceResolverHelperImpl
   4958 LOG Calling filter: org.apache.sling.security.impl.ContentDispositionFilter
   4961 LOG Calling filter: com.adobe.granite.csrf.impl.CSRFFilter
   4966 LOG Calling filter: org.apache.sling.i18n.impl.I18NFilter
   4970 LOG Calling filter: com.adobe.granite.httpcache.impl.InnerCacheFilter
   4979 LOG Calling filter: org.apache.sling.rewriter.impl.RewriterFilter
   4982 LOG Calling filter: com.adobe.cq.history.impl.HistoryRequestFilter
   7870 LOG Calling filter: com.day.cq.wcm.core.impl.WCMRequestFilter
   7908 LOG Calling filter: com.adobe.cq.wcm.core.components.internal.servlets.CoreFormHandlingServlet
   7912 LOG Calling filter: com.adobe.granite.optout.impl.OptOutFilter
   7921 LOG Calling filter: com.day.cq.wcm.foundation.forms.impl.FormsHandlingServlet
   7932 LOG Calling filter: com.day.cq.dam.core.impl.servlet.DisableLegacyServletFilter
   7935 LOG Calling filter: org.apache.sling.engine.impl.debug.RequestProgressTrackerLogFilter
   7938 LOG Calling filter: com.day.cq.wcm.mobile.core.impl.redirect.RedirectFilter
   7940 LOG Calling filter: com.day.cq.wcm.core.impl.AuthoringUIModeServiceImpl
   8185 LOG Calling filter: com.adobe.granite.rest.assets.impl.AssetContentDispositionFilter
   8201 LOG Calling filter: com.adobe.granite.requests.logging.impl.RequestLoggerImpl
   8212 LOG Calling filter: com.adobe.granite.rest.impl.servlet.ApiResourceFilter
   8302 LOG Calling filter: com.day.cq.dam.core.impl.servlet.ActivityRecordHandler
   8321 LOG Calling filter: com.day.cq.wcm.core.impl.warp.TimeWarpFilter
   8328 LOG Calling filter: com.day.cq.dam.core.impl.assetlinkshare.AdhocAssetShareAuthHandler
These are all request-level filters, which are executed just once per request.
And now the interesting part starts: the rendering of the page itself. The building blocks are called “components” (that term is probably familiar to you) and it always follows the same pattern:
- Calling Component Filters
- Executing the Component
- Return from the Component Filters (in reverse order of the calling)
This pattern can be clearly seen in the output, but most often it is more complicated because many components include other components, and so you end up in a tree of components being rendered.
As an example for the straight forward case we can take the “head” component of the page:
  25849 LOG Including resource MergedResource [path=/mnt/overlay/granite/ui/content/globalhead/experiencelog, resources=[/libs/granite/ui/content/globalhead/experiencelog]] (SlingRequestPathInfo: path='/mnt/overlay/granite/ui/content/globalhead/experiencelog', selectorString='null', extension='html', suffix='null')
  25892 TIMER_START{resolveServlet(/mnt/overlay/granite/ui/content/globalhead/experiencelog)}
  25934 TIMER_END{40,resolveServlet(/mnt/overlay/granite/ui/content/globalhead/experiencelog)} Using servlet BundledScriptServlet (/libs/cq/experiencelog/components/head/head.jsp)
  25939 LOG Applying Includefilters
  25943 LOG Calling filter: com.adobe.granite.csrf.impl.CSRFFilter
  25951 LOG Calling filter: com.day.cq.personalization.impl.TargetComponentFilter
  25955 LOG Calling filter: com.day.cq.wcm.core.impl.page.PageLockFilter
  25959 LOG Calling filter: com.day.cq.wcm.core.impl.WCMComponentFilter
  26885 LOG Calling filter: com.day.cq.wcm.core.impl.monitoring.PageComponentRequestFilter
  26893 LOG Calling filter: com.adobe.granite.metrics.knownerrors.impl.ErrorLoggingComponentFilter
  26896 LOG Calling filter: com.day.cq.wcm.core.impl.WCMDebugFilter
  26899 LOG Calling filter: com.day.cq.wcm.core.impl.WCMDeveloperModeFilter
  28125 TIMER_START{BundledScriptServlet (/libs/cq/experiencelog/components/head/head.jsp)#1}
  46702 TIMER_END{18576,BundledScriptServlet (/libs/cq/experiencelog/components/head/head.jsp)#1}
  46734 LOG Filter timing: filter=com.day.cq.wcm.core.impl.WCMDeveloperModeFilter, inner=18624, total=19806, outer=1182
  46742 LOG Filter timing: filter=com.day.cq.wcm.core.impl.WCMDebugFilter, inner=19806, total=19810, outer=4
  46749 LOG Filter timing: filter=com.adobe.granite.metrics.knownerrors.impl.ErrorLoggingComponentFilter, inner=19810, total=19816, outer=6
  46756 LOG Filter timing: filter=com.day.cq.wcm.core.impl.monitoring.PageComponentRequestFilter, inner=19816, total=19830, outer=14
  46761 LOG Filter timing: filter=com.day.cq.wcm.core.impl.WCMComponentFilter, inner=19830, total=20750, outer=920
  46767 LOG Filter timing: filter=com.day.cq.wcm.core.impl.page.PageLockFilter, inner=20750, total=20754, outer=4
  46772 LOG Filter timing: filter=com.day.cq.personalization.impl.TargetComponentFilter, inner=20754, total=20758, outer=4
At the top you see the LOG statement “Including resource …” which provides you with the information what resource is rendered, including additional information like selector, extension and suffix.
As next statement we have the resolution of the renderscript which is used to render this resource, plus the time it took (40 microseconds).
Then we have the invocation of all component filters, the execution of the render script itself, which is using a TIMER to record start time, end time and duration (18576 microseconds), and the unwinding of the component filters.
If you use a recent version of the SDK for AEM as a Cloud Service, all timestamps are in microseconds, but in AEM 6.5 and older the duration measured for the Filters (inner=…, outer=…) were printed in miliseconds (which is an inconsistency I just fixed recently).
If a component includes another component, it looks like this:
8350 LOG Applying Componentfilters
   8358 LOG Calling filter: com.day.cq.personalization.impl.TargetComponentFilter
   8361 LOG Calling filter: com.day.cq.wcm.core.impl.page.PageLockFilter
   8365 LOG Calling filter: com.day.cq.wcm.core.impl.WCMComponentFilter
   8697 LOG Calling filter: com.day.cq.wcm.core.impl.monitoring.PageComponentRequestFilter
   8703 LOG Calling filter: com.adobe.granite.metrics.knownerrors.impl.ErrorLoggingComponentFilter
   8733 LOG Calling filter: com.day.cq.wcm.core.impl.WCMDebugFilter
   8750 TIMER_START{BundledScriptServlet (/libs/granite/ui/components/shell/page/page.jsp)#0}
  25849 LOG Including resource MergedResource [path=/mnt/overlay/granite/ui/content/globalhead/experiencelog, resources=[/libs/granite/ui/content/globalhead/experiencelog]] (SlingRequestPathInfo: path='/mnt/overlay/granite/ui/content/globalhead/experiencelog', selectorString='null', extension='html', suffix='null')
  25892 TIMER_START{resolveServlet(/mnt/overlay/granite/ui/content/globalhead/experiencelog)}
  25934 TIMER_END{40,resolveServlet(/mnt/overlay/granite/ui/content/globalhead/experiencelog)} Using servlet BundledScriptServlet (/libs/cq/experiencelog/components/head/head.jsp)
  25939 LOG Applying Includefilters
[...]
148489 LOG Filter timing: filter=com.day.cq.wcm.core.impl.WCMDeveloperModeFilter, inner=1698, total=1712, outer=14
 148500 LOG Filter timing: filter=com.day.cq.wcm.core.impl.WCMDebugFilter, inner=1712, total=1717, outer=5
 148509 LOG Filter timing: filter=com.adobe.granite.metrics.knownerrors.impl.ErrorLoggingComponentFilter, inner=1717, total=1722, outer=5
 148519 LOG Filter timing: filter=com.day.cq.wcm.core.impl.monitoring.PageComponentRequestFilter, inner=1722, total=1735, outer=13
 148527 LOG Filter timing: filter=com.day.cq.wcm.core.impl.WCMComponentFilter, inner=1735, total=2144, outer=409
 148534 LOG Filter timing: filter=com.day.cq.wcm.core.impl.page.PageLockFilter, inner=2144, total=2150, outer=6
 148543 LOG Filter timing: filter=com.day.cq.personalization.impl.TargetComponentFilter, inner=2150, total=2154, outer=4
 148832 TIMER_END{140080,BundledScriptServlet (/libs/granite/ui/components/shell/page/page.jsp)#0}
You see the component filters, but then after the TIMER_START for the page.jsp (check the trailing timer number: #0, every timer has a unique ID!) line you see the inclusion of a new resource. For this again the render script is resolved and instead of the ComponentFilters the IncludeFilters are called, but in the majority of cases the list of filters are identical. And depending on the resource structure and the script, the rendering tree can get really deep. But eventually you can see that the the rendering of the page.jsp is completed; you can easily find it by looking for the respective timer ID.
Equipped with this knowledge you can now easily dig into the page rendering process and see which resources and resource types are part of the rendering process of a page. And if you are interested in the bottlenecks of the page rendering process you can check the TIMER_END lines which both include the rendering script plus the time in microseconds it took to render it (be aware, that this time also includes it too to render all scripts invoked from this render script).
But the really cool part is that this is extensible. Via the RequestProgressTracker you can easily write your own LOG statements, start timers etc. So if you want to debug requests to better understand the timing, you can easily use something like this:
slingRequest.getRequestProgressTracker().log("Checkpoint A");
And then you can find this log message in this screen when this component is rendered. You can use it to output useful (debugging) information or just have use its timestamp to identify performance problems. This can be superior to normal logging (to a logfile), becaus you can leave these statements in production code, and they won’t pollute the log files. You just need to have access to the OSGI webconsole, search for the request you are interested and check the rendering process.
And if you are interested, you can can also get all entries in this screen and do whatever you like. For example you can write a (request-level) filter, which calls first the next filter, and afterwards logs all entries of the RequestProgressTracker to the logfile, if the request processing took more than 1 second.
The Request Progress Tracker plus the “Recent Requests” Screen of the OSGI webconsole are a really cool combination to both help you to understand the inner working of the Sling Request Processing, and it’s also a huge help to analyze and understand the performance of request processing.
I hope that this technical deep dive into the sling page rendering process was helpful for you, and you are able to spot many interesting aspects of an AEM system just be using this tool. If you have questions, please leave me a comment below.

It’s been a long time indeed since that console plugin was NOT there, it was created back in June 2019. In the good old times of https://issues.apache.org/jira/browse/SLING-1000 😉
I mean June 2009 of course…not used to type such old dates anymore.