Apache Sling and AEM provide 2 different approaches to start processes at a given time or in a given interval. It is not always trivial to make the right decision between these two, and I have seen a few cases of misuse already. Let’s dive into this topic and I will outline in what situation to use the Scheduler and when to use Scheduled Jobs.
Continue reading “Sling Scheduled Jobs vs Sling Scheduler”Category: AEM Concepts
AEM micro-optimizations (part 3)
Welcome to my third post on AEM micro-optimizations. Again with some interesting ways how you can improve your AEM application performance, somethings with little improvements, but sometimes with significant ones.
During some recent performance optimization I came across code, which felt a bit odd. Technically it was quite easy:
for (Item item : manyItems) {
proprocessSingleItem (resolver, item);
}
void processSingleItem (ResourceResolver resolver, Item i} {
// do something with the resourceResolver
resolver.commit();
}
That is indeed a very common pattern, especially in software, which evolved over time: You have code, which deals with a single item. And later, if you need to do it for multiple items, you execute this code in a loop. Works perfectly, and the pattern is widely used.
And it can be problematic.
If you have an operation in that performSingleItem()
method, which comes with a method creating some overhead . Maybe you are not aware of that overhead, so it goes unnoticed. Maybe you expect, that if a that performSingleItem()
method takes 5 ms for an item, requiring 50 ms for 10 items is ok. Well, an O(n) algorithm isn’t too bad, is it?
But what if I tell you, that the static overhead of that method is that so large, that providing 10 items as parameters instead of just one will increase the runtime of it not by a factor of 10, but only by a factor of 1.1?
Imagine you need to go grocery shopping for your Sunday dinner. You get yourself ready, take the bike to the grocery store, get the potatoes you need. Pay, and get back home. Drop the potatoes there. Then again, taking the bike to the grocery store, getting the some meat. Back home. Again to the grocery store, this time for paprika (grilled paprika are delicious …). And so on and so on, until you have everything you need for your barbecue on Sunday. You spent now 6 hours mostly on the bike and waiting at the counter.
Are you doing that? No, of course not. You drive once to the grocery store, get all the things and pack them onto your bike, and get home. Takes maybe 90 minutes. Have the static overhead (cycling, waiting at the counter) just once saves a lot of it.
It’s the same in coding. You have static overhead (acquiring locks, getting database connections, network latency, calling through thick framework layers will just copying references to the data), which is not determined by the amount of data you process. But unlike in the example of grocery shopping it’s not directly visible at which times there is such a static overhead, and unfortunately documentation rarely point that out.
Writing to the repository comes with such a static overhead; and it can be like a 20 minutes ride to the grocery store. Saving 10 times smaller batches definitely takes more time than saving once with a batch of 10-times the size. At least if you keep the size of the changeset limited, for details here check this earlier posting of mine.
Check this great presentation of Georg Henzler at adaptTo() 2019 (starting at 17:00min ) (slides) for some benchmark data, how the size of the changeset influences the time to save (spoiler: for realistic sizes it does not really increase).
So I changed the above code to something like this:
for (Item item : manyItems) {
proprocessSingleItem (resolver, item);
}
resolver.commit();void processSingleItem (ResourceResolver resolver, Item i} {
// do something with the resourceResolver
but no commit}
Switching to this approach improved the performance for ~ 100 items by a factor of more than 10! And that’s an impressive number for such a minimal change.
So check your code for this specific coding pattern, find out if the parameters are good (that means small changes) and add some performance logging. And then convert to this batching mode and see what your numbers are doing.
Of course, very often this saving is operating in the context of a much larger operation, and a 10 times improvement in this area will only speed up the larger operation of 12 seconds to 11 seconds. But hey, when you get this 1 second for almost free, just do it (and we are still talking about micro-optimizations). But nothing prevents you from taking a deeper look into what the system is doing in the remaining 11 seconds.
Leave me a comment if you have some interesting story to share, where such small changes resulted in big improvements.
AEM micro-optimization (part 2)
Micro optimizations are important, and their importance is described by a LWN posting about the linux kernel:
Most users are unlikely to notice any amazing speed improvements resulting from these changes. But they are an important part of the ongoing effort to optimize the kernel’s behavior wherever possible; a long list of changes like this is the reason why Linux performs as well as it does.
And is not specific for the Linux kernel, but you can apply the same strategy to every piece of software. AEM as a complex (and admittedly, it can sometimes be really slow) beast applies the very same.
There are a number of cases in AEM, where do you operate not only single objcets (pages, assets, resources, nodes), but apply the same operation on multiple of these objects.
The naive approach of just iterating the list and execute the operation on a single element of that list can be quite ineffective, especially if this operation comes with a static overhead.
Some examples:
- For replication there are some pre-checks, then the creation of the package, the creation of the sling jobs (or sending the package to the pipeline when running on AEM as a Cloud Service), the update of the replication status, writing the audit log entries.
- When determining the replication status of a page, the replication queues need to checked if this page is still subject to a pending replication, which can get slow when the queues are full.
- Committing changes to the JCR repository; there is a certain overhead in it (validating all changes, comitting them to permanent storage, invoking the synchronous listeners, locking etc).
And in many cases these bottlenecks are known for a while, and there is API which allows to perform this action in a batch mode for a multitude of elements:
- Replication: Batch replication (you can provide a number of path strings)
- Getting status for a large amount of resources: ReplicationStatusProvider.getBatchReplicationStatus
- The Audit Log
- and many more
(The ReplicationStatusProvider has been introduced some years back when we had to deal with large workflow packages being replicated, which resulted in a lot of traversales of the replication queue entries. Adding this optimized version improved the performance by at least a factor of 10; so even in less intense operations I expect an improvement.
So if you have a hand-crafted loop to execute a certain activity on many elements, check if a more efficient batch API is available. There’s a good chance that it is already there.
If you have more cases where batch mode should be available, you it isn’t, leave a comment here. I am happy to support to either find the right API or potentially kickstart a product improvement.
Long running sessions and clustering
In the last blog post I briefly talked about the basics what to consider when you are writing cluster-aware code. The essence is to be aware of your write activities, and make sure that the scheduled activities are running only on a single cluster node and not on many or all of them.
Today’s focus is on the behavior of JCR sessions with respect to clustering. From a conceptual point of view there is hardly a difference to a single-node cluster (or standalone instance), but the presence of more cluster nodes add a new angle of potential problems to it.
When I talk about JCR, I am thinking of the Apache Oak implementation, which is implemented on top of the MVCC pattern. (The previous Jackrabbit implementation is using a different approach, so this whole blog post does not apply there.) The basic principle of MVCC is that each session is clearly separated from any other session which is open in parallel. Also any changes performed on a session is not visible to other sessions unless
- the other session is invoking session.refresh() or
- the other session is opened after the mentioned session is closed.
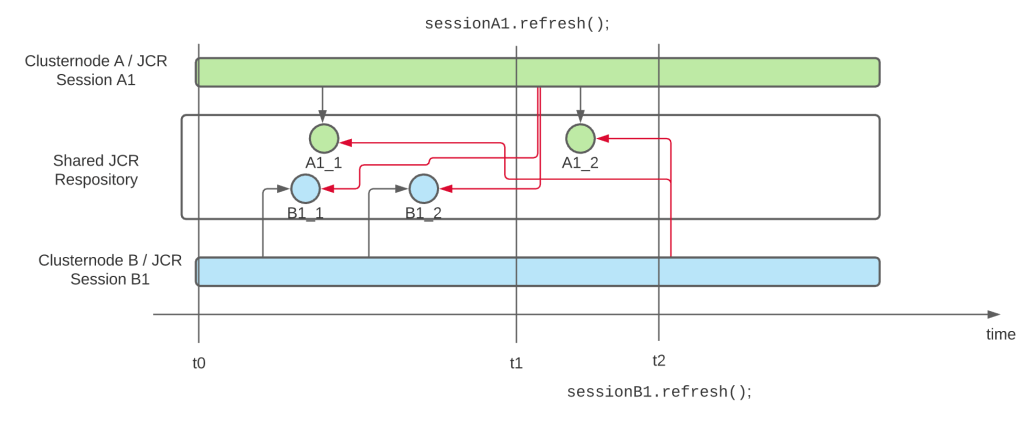
This behavior applies to all sessions of a JCR repository, no matter if the are opened on the same cluster node or not. The following diagram visualizes this

We have 2 sessions A1 and B1 which are initiated at the same time t0, and which perform changes independently of each other on the repository, so session B1 cannot see the changes performed with A1_1 (and vice versa). At time t1 session A1 is refreshed, and now it can see the changes B1_1 and B1_2. And afterwards B1 is refreshed as well, and can now see the changes A1_1 and A1_2 as well.
But if a session is not refreshed (or closed and a new session is used), it will never see the changes which happened on the repository after the session has been opened.
As said before, these sessions do not need to run on 2 separate cluster nodes, you get the same behavior on a single cluster node as well. But I mentioned, that multiple cluster nodes are a special problem here. Why is that case?
That problem are OSGI services in the background, which perform a certain job and write data to the JCR repository. In a single-node cluster this not a problem, because all of these activities go through that single service; and if that service uses a long-running JCR session for it, that will never be a problem. Because this service is responsible for all changes, and the service can read and write all the relevant data. In a cluster with more than 2 nodes, each cluster node might have that service running, and the invocations of the services might be random. And as in the diagram above, on cluster node A the data A1_1 is written. And on cluster node 2 the data point B1_1 is written. But they don’t see each other’s changes if they don’t refresh the session! And in most applications, which are written for single-node AEM instances, session.refresh() is barely used, because in such situations there’s simply no need for it, as this problem never occurred.
So when you are migrating your application to AEM as a Cloud Service, review your applications and make sure that you find all long-running ResourceResolvers and JCR sessions. The best option is then to remove these long-running sessions and replace them with short-living ones, which are closed if the job is done. The second-best option is to introduce a session.refresh(), so the session sees any updates which happend to the repository in the meanwhile. (And btw: if you registering an ObservationListener in that session, you don’t need a manual refresh, as this refresh is done by the ObservationListener method anyway; what would it be for if not for reporting changes to the repository, which happen after opening the session?)
That’s all right now regarding cluster-aware coding. But I am sure that there is more to come 🙂
Cluster aware coding in AEM
With AEM as a Cloud Service quite a number of small things have changed; and next to others you also get real clustering support in the authoring environment. Which is nice, because it gives you downtime-less authoring during deployments.
But this cluster also comes with a few gotchas, and one of them is that your application code needs to be cluster-aware. But what does that mean? What consequences does it have and what code do you have to change if you have never paid attention to this aspect?
The most important aspect is to do “every change only once“. It doesn’t make sense that 2 cluster nodes are importing the same set of data. A special version of this aspect is “avoid concurrent writes to the same node“, which can happen when a scheduled job is kicked off at the same time on all nodes, and this job is trying to change something in the repository. In this case you don’t only have overhead, but very likely a lot of exceptions.
And there is a similar aspect, which you should pay attention to: connections to external systems. If you have a cluster, running the same code and configs, it’s not always wanted that each cluster node reaches out to that external system. Maybe you need to the update it with the latest content only once, because it triggers some expensive processing on their side, and you don’t want to have that triggered two or three times, probably pretty much at the same time.
I have mentioned you 2 cases where a clustered application can be behave differently than a single-node environment, now let me show you how you can make your application cluster-aware.
Scheduled jobs
Scheduled jobs are a classic tool to execute certain jobs at a certain time. Of course we could use the Sling Scheduler directly, but to make the execution more robust, you should wrap it into a Scheduled Sling Job.
See the Sling Jobs website for the documentation and some example (although the Javadocs are missing the ScheduleBuilder class, but here’s the code). And of course you should check out Kaushal Mall’s post with even more examples.
Jobs give you the guarantee, that this job is going to be executed only at least once.
Use the Sling Scheduler only for very frequent jobs (e.g. once every 5 minutes), where it doesn’t matter if one execution is skipped, e.g. because the instance was just restarting. To limit the execution of such a job to a single node, you can annotate the job runner with this annotation:
@Property (name="scheduler.runOn", value="SINGLE")
What about caches?
In-memory caches are often used to speed up operations. Most often they contain the results of previous operations which are then reused; cache elements are either actively purged or expire using a time-to-live.
Normally such caches are not affected by clustering. They might contain different items with potentially different values in the cluster nodes, but that must never be a problem. If that is a problem, you have to look for a different approach, e.g. persisting the data to the repository (if they are not already coming from there) or externalizing the cache (e.g to a redis or memcached instance).
Also, having a simpler application instead of the highest-cache-hit ration possible is often a good trade-off.
Ok, these were the topics I wanted to discuss here. But expect a blog post about one of my favorite topics: “Long running sessions and clustering“.
When is AEM fully started?
Or in other words: How can I know that the instance is fully working?
A common task when you work with automation is a realiable detection when the AEM instance is up and running. Maybe you reconfigure the loadbalancer to send requests to this instance. Or you just start doing some other work.
The most naive approach is to request a AEM page and act on the HTTP status code. If the status is “200”, you consider the system up and running. If you get any other code, it’s not. Sounds easy, is easy. But not really accurate. Because there are times during startup, when the system returns a status code 200, but a blank page. Unfortunate.
So next approach: Check if all bundles are active. Check /system/console/bundles.json and parse it. Look for a statement like this:
status":"Bundle information: 447 bundles in total - all 447 bundles active.
Nice try, but does not work. All bundles being up does not guarantee, that all the services are up as well.
The third approach is more compplicated and requires coding, but delivers good results: Build a healthcheck which depends on a lot of other services (the ones you consider important). If this healthcheck is present and delivers ok, it means, that all services it depends on are active as well (the simple default semantic of the @Reference annotation guarantees that). This does not necessarily mean, that the startup is finished, but just that the services you considered relevant are up.
And finally there is a fourth approach, which has been built specifically for this case: The startup listeners. It’s a service interface you can implement, and you get notified when the system is up. That’s it. The API does not give any guarantee that if the system is up, that 5 minutes later it is still up. I am not 100% sure so the semantics of this approach if a service fails to start. Or if a service decides to stop (or starts throwing exceptions).
The healthcheck is my personal favorite. It can be used not only to give you information about a single event (“the system is up”), but it can take much more factors into account to decide if the system is up. And these factors can be constantly checked. When a service is no longer available, the healthcheck goes to ERROR (“red”), and it’s available again, the healthcheck reports OK again. The approach is more powerfull, provides better extensibility and is quite easy to understand. So I choose a healthcheck everytime when I need to know about the health state of AEM.
You must be logged in to post a comment.