AEM and docker – a question of state

The containerization of the IT world continues. What started with virtualization in the early 2000s has reached with Docker a state, where it’s again a hype topic.

Therefor it’s natural that people also started to play with AEM in docker (https://adapt.to/2016/en/schedule/running-aem-in-docker.html, https://www.linkedin.com/pulse/running-aem-docker-satendra-singh and many more).

Of course I was challenged with the requirement to run AEM in docker too. Customers and partners asking how to run AEM in docker. If I can provide dockerfiles etc.  I am hestitating to do it, because for me docker and AEM are not a really good fit (right now with AEM 6.3 in 2017).

Some background first: Docker containers should be stateless. Only if the application within the container does not hold any persistent state, you can shut it down (which means deleting all the files created by the application in the container itself), start it up, replace it by a different container holding a new version of the application etc. The whole idea is to make the persistent state somebody else’s problem (typically a database). Deployments should be as easy as starting new docker instances (from a pre-tested and validated docker images) and shutting down the old ones. Not working and testing in production anymore.

So, how does that collide with AEM? AEM is not only an application, but the application is closely tied with a repository, which holds state. Typically the application is stored within the repository, next to the “user data” (= content). This means, that you cannot just replace an AEM instance inside docker by a new instance without loosing this content (or resetting it to a state, which is shipped with the docker image). Loosing content is of course not acceptable.

So the typical docker rollout approach of new application versions (bringing new instances live based on a new docker image and shutting down the old ones) does not work with AEM; the content sitting in the repository is the problem.

People then came up with the idea, that the repository can stored outside of the docker image, so isn’t lost on restart/replacement of the image. Docker calls this “host directory as data volume” (https://docs.docker.com/engine/tutorials/dockervolumes/#locate-a-volume).

Storing the repo as data volume on the host filesystem

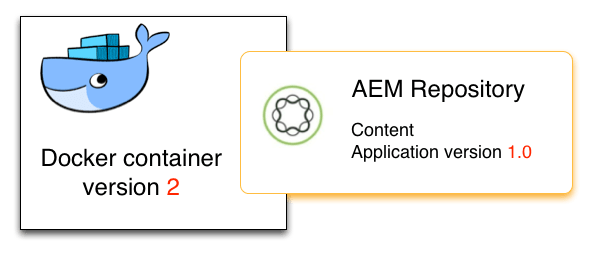
That idea sounds neat and of course it works. But then we have a different problem. When you start a new docker image and you mount this data volume containing the repository state, your AEM still runs the “old” version of your application. Starting the repository from a different docker image doesn’t bring any benefit then.

Docker image version 2 still starts application version 1.0

When you want to update your AEM application inside the repository, you would still need to perform an installation of your application into a running repository. Working in a production environment. And that’s not the idea why you want to use docker.
With docker we just wanted to start the new images and to stop the old ones.

Therefor I do not recommend to use docker with AEM; there is rarely a value for it, but it makes the setup more complicated without any real benefit.

The only exceptions I would accept are really short-lived instances, where hosting the repository inside the docker system isn’t a problem and purging the repo on shutdown is even a feature. Typically these are short-lived development instances (e.g. triggered by Continous integration pipeline, where you automatically create dedicated docker instances for feature branches). But that’s it.

And as a sidenote: This does not only affect TarMK-based AEM instances. If you have mongo-based instances, the application is also stored within the (Mongo-) repo. Just running AEM in a new docker image doesn’t update the application magically.

To repeat myself: This considers the current state. I know that the AEM engineering is perfectly aware of this fact, and I am sure that they try to adress it. Let’s wait for the future 🙂

CRX 2.3: snapshot backup

About a year ago I wrote an improved version of backup for CRX 2.1 and CRX 2.2. The approach is to reduce the amount of data which is considered by the online backup mechanism. With CRX 2.3 this apprach can still be used, but now an even better way is available.

A feature of the online backup — the blocking and unblocking of the repository for write operations — is now available not only to the online backup mechanism, but can be reached via JMX.
JMX view

So, by this mechanism, you can prevent the repository from updating its disk structures. With this blocking enabled you can backup all the repository and then unblock afterwards.

This allows you to create a backup mechanism like this:

  1. Call the blockRepositoryWrites() method of the “com.adobe.granite (Repository)” Mbean
  2. Do a filesystem snapshot of the volume where the CRX repository is stored.
  3. Call “unblockRepositoryWrites()
  4. Mount the snapshot created in step 2
  5. Run your backup client on the mounted snapshot
  6. Umount and delete the snapshot

And that’s it. Using a filesystem snapshot instead of the online backup accelerates the whole process and the CQ5 application is affected (step 1 – 3) only for a very small timeframe (depending on your system, but should be done in less than a minute).

Some notes:

  • I recommend snapshots here, because they are much faster than a copy or rsync, but of course you can use these as well.
  • While the repository writes are blocked, every thread, which wants to do a write operation on the repository, will be blocked, read operations will work. But with every blocked write operation you’ll have one thread less available. So in the end you might run into a case, where no threads are available any more.
  • Currently the UnlockRepositoryWrites call can be made only by JMX and not by HTTP (to the Felix Console). That should be fixed within the next updates of CQ 5.5. Generally speaking I would recommend to use JMX directly over HTTP-calls via curl and the Felix Console.

Java 7 support for CQ5?

As Java 7 has been launched these days, the question arises real soon: “Does Adobe support Java 7 as runtime for CQ5?”.

So, the clear answer is: No, it isn’t supported. Mostly because of some issues which can cause corruptions in the Lucene index. So, of course, you give it a try and tackle the risk yourself (as you can run CQ5 on a Windows 7 box or on Debian Linux); but don’t complain, if you receive some strange behaviour.

ps: Just adding -XX:-UseLoopPredicate to your JVM parameters won’t solve the problem (according to the Lucene Website).

Adding JMX-support

CQ5 (even in its latest incarnation CQ 5.4) has a rather poor support for monitoring. If you take a look at the system via the popular “jconsole” tool, you don’t get any useful mbeans, which can tell you anything about the system. Only some logging stuff.

If you decide to instrument your code and provide some information via JMX (that’s something I would recommend to everyone, who adds non-trivial services to CQ5), have a look at Apache Aries, especially at the JMX whiteboard. Deploy this bundle to your CQ5 and then just register your mbeans as services. Voila, that’s it. You don’t need to register and unregister your mbeans, as this is handled by the JMX whiteboard.

Sadly documentation is currently rather poor, but the sourcode isn’t that hard to understand. You can start with the initial patch in the Aries issue tracking.

Maintenance mode

I just stumbled over my old article on locking out users and felt, that it is a bit outdated. The mechanism described there is only suitable for CQ3 and CQ4, but is not applicable for CQ5, because there is no “post” user, and the complete access control mechanism has changed.

In CQ5 it is incredibly easy to install ServletFilters (thanks OSGI and Declarative Services); so I wrote a small servlet filter, which blocks requests originating from users, which are not whitelisted. That’s a nice solution, which does not require any intrusive operation such as changing ACLs or such. You just need to deploy a tiny little bundle, put “admin” on the whitelist and enable the maintenance in the Felix webconsole. That’s it.

I will submit this package (source code plus compiled bundle) to the Day package share, licensed under Apache 2.0 License. It may take a bit, but I will place it to the public area, so you can grab it and study the source (it’s essentially only the servlet class).

Building custom CQ5 installation images

Very often one needs to setup a number of CQ5 installations with the same featuresets; e.g if you start with a bunch of new publishing instances or you need to update your development environments with a new set of hotfixes.

One way is to provide a detailled list of instructions plus the required files to the people responsible for it. It’s important to be consistent over all affected installations and environments, so you can remedy problems and issues because of missing fixes or wrong installation. But then a lot of manual work is included, which isn’t the thing IT people want to do.

I needed to provide several CQ5 installations in the last time. Because my standard installation recommendation consists of CQ 5.3 plus CRX 2.1 plus performancepack 30015 (using CQSE and the TarPM) at the moment, just deploying a CQ 5.3 the usual way isn’t sufficient. But on the other hand I don’t want to have the work of a manual installation of CRX 2.1 and the performancepack on top of a default CQ 5.3, both including restarts.

So I decided to build an image, which contains all these components, without the need for an restart, without fiddling around with the package manager, just by using some hidden features of CQ5.3 and CRX: the package installer and the flawless upgrade procedure of CRX 2.x (x={0,1}, will probably work also for later versions of CRX). You can find the documentation of the upgrade process also on the official documentation site.

1.) Unpack a plain CQ 5.3:

$ cd cq530
$ java -jar cq-wcm-quickstart-author-5.3.0.jar -unpack

2.) Get CRX 2.1 and unpack it:

$ cd crx21
$ java -jar crx-2.1.0.20100426-enterprise.jar -unpack

3.) Copy the CRX webapplication file of CRX 2.1 into the unpacked CQ 5.3 installation:

$ cp crx21/crx-quickstart/server/webapps/crx-explorer_crx.war cq530/crx-quickstart/server/webapps

4.) Remove the CRXDE webapplication of CQ 5.3, as it is no longer needed for CRX 2.1

$ cd cq530/crx-quickstart/server/webapps
$ rm crx-de_crxde.war

5.) Edit also the server.xml, and remove the crxde webapp

6.) Define an order, in which the packages are deployed to CRX; as the packages are deployed in the order, they are listed by default in a shell, I define an order by explictly naming the files like “01_cq-content-5.3.jar”, “10_cq-documentation-5.3.zip” and so. The files must be placed in the cq530/crx-quickstart/repository/install folder.

Make sure that the original “cq_content-5.3.jar” is deployed as first package, as it contains the WCM code. But then you can place there any CQ package you want: hotfixes, custom application code, initial content etc.

$ cd cq530/crx-quickstart/repository/install
$ cp cq-content-5.3.jar 01_cq-content-5.3.jar
$ cp cq-documentation-5.3.zip 10_cq-documentation-5.3.zip
$ cp .........../cq-5.3.0-featurepack-30015-1.0.zip 50_cq-5.3.0-featurepack-30015-1.0.zip

7.) If you want to use the CRXDE, you should download the file cq53-update-crxdesupport-2.1.0.zip from Day PackageShare and copy it also into the install directory:

$ cp ......../cq53-update-crxdesupport-2.1.0.zip 05_cq530/crx/repository/install

8.) For convenience you can place now your license.properties file next in the toplevel directory of your installation, the result should be something like this:

$ ls -la
-rw-r--r--   1 jorghoh  staff  233110810  6 Aug 09:38 cq-wcm-quickstart-author-5.3.0.jar
drwxr-xr-x  10 jorghoh  staff        340  7 Okt 17:55 crx-quickstart
-rw-r--r--   1 jorghoh  staff        217  6 Aug 09:39 license.properties

If you don’t want to deliver the license file with that image, you can omitt it; if the instance is started the first time, it is asked then.

9.) Now all parts are in place; so you can create an image file (tar file) and distribute it all over your environments:

$ cd cq530/..
$ tar -cf cq530-crx21-author-image.tar cq530/*

(if you rename the cq-wcm-quickstart-author-5.3.0.jar file to cq-wcm-quickstart-publish-5.3.0.jar, you have an image for a publish instance.)

Just unpack it and use your usual startup mechanisms (“start.bat” or “start”), and the framework will startup as usually, create a repository and also deploy all packages in the install folder directly to it. If you encounter problems, you may check with the Felix console, if all bundles are started.

Now you have an image, which you can copy and uncompress everywhere, even the plattform (Unix, Windows) doesn’t matter, as all is only dependent on the features of CRX Launchpad and CRX itself. A setup of a new emtpy instance, independent of the number of installed packages and hotfixes, can now be done within 2 minutes and can be fully automated.

CQ5 logging

This week I held a workshop at a customer and someone asked me “How do other customers of Day handle their logfiles? Do they check them and analyze the logfiles?” I had to admit that “according to my experience nobody really cares about them. The only situation they care about them is when the disk is full f them.” Yeah, a sad truth.

But this brings us to todays topic: Logfiles and keeping track of them. CQ5 is by default pretty noisy; if you check the file crx-quickstart/logs/error.log after some requests have been made, you see a lot of messages of loglevel “INFO”. Yes, sometimes quite interesting, but in the end they pollute the log and the real important messages vanish in the pure mass of these noise. So, at least for production systems, the loglevel should incrased to WARN or even “ERROR”, so only logs at level WARN or ERROR are logged, INFO is supressed.

So, how can this be achieved? Sling as part of the WCM part of CQ5 brings its own logging, it can be configured using the Felix console and is well documented on the Day documentation site. CRX (at least up to CRX 2.1) does have its own logging mechanisms (log4j), which can be reconfigured in the crx-quickstart/server/runtime/0/_crx/WEB-INF/log4j.xml file.

And, on top of this all, we have on a standard Unix system

  • crx-quickstart/logs/stderr.log and crx-quickstart/logs/stdout.log
  • crx-quickstart/logs/server.log
  • crx-quickstart/server/logs/startup.log

neat, isn’t it? Ok, how can you configure them?

Short answer: you can’t. At least it isn’t documented.

The stdout.log and stderr.log and the standard output and standard error channel of the java process, which is redirected to these files. Especially stdout.log fills up pretty fast, because CRX logs all its messages also to the stdout. So fixing up the log4j.xml file is mandatory, because we don’t need this information twice in the crx/error.log and the stdout.log file. Oh, and of course these files aren’t rotated, but new data is appended only. So it grows and grows and grows.

The server.log file is written by the CQSE servlet engine and cleared when the servlet engine is started. Same as for the startup.log, which contains the output of the serverctl script before starting the java and also error messages, if the java process doesn’t start at all (most times due to invalid parameters).

A few recommendations (just a personal point of view):

  • Log rotation should be performed on a timely basis and not be based on the size of the logfile. You should have enough space then and monitor it closely, of course. But this helps you to lookup a certain problem (“Wait, it was yesterday, so it must be in error.log.0 file”) without hassles.
  • implement your own logfile rotation for the stdout.log and stderr.log files. I fill a bug for it too, but till then you need to help yourself. Sorry.
  • Increase loglevel to WARN. INFO just logs too much noise.
  • Adjust the log4j.xml of CRX and change it to something like this:
<root>
 <level value="warn" />
 <appender-ref ref="error"/>
 </root>

So adjusting the logging according to your needs shows, that you care about them and know, that they are useful at all. Which is a required step to do some analysis on them. But that topic is a candidate for one of the next postings.

Application monitoring vs System monitoring

Recently I was asked how a CQ monitoring should be setup. The question was acompanied by a very short description, how the monitoring was supposed to look like. There were some points like “monitoring the publishing by requesting pages”, “check if the java process is running” and “checking the free disk space”. Obviously they just setup some new servers for this environment and thought that they need to monitor some parameters.

As a first step I advised to separate the topics “application monitoring” and “system monitoring”. One might wonder why I suggest to make a strong division between these topics, so here the background.

Standardization is one of the key topics in IT; everything, what is standardized, can be reused, can be exchanged by a compatible product, and finally lowers the cost. So IT operation teams tend to standardize as much as they can, because as intermediate step to lower costs standardization allows automation.

Basic system monitoring is such a thing. Every computer has componentes, which can be monitored such way: Disk health, CPU temperature, status of the power supply units, internal temperature. But also CPU utlization, free disk space, network connectivity or if the system starts to swap. And many more. These are basic metrics which can be measured and monitored in a consistent and automatic way.

For these points it doesn’t care if the system runs a data warehouse application, a mailserver or CQ. They are all the same and the reaction is really comparable if one of these monitored things fails: If a disk is dead, one needs to replace it (with not-so-old servers you can do this online and without service interruption). The procedure may differ from computer to computer, but the basic action is always the same: When the monitoring shows that a disk failed, lookup the type of the failed disk, get a new one, and go the computer and replace it according to the guidelines of the computer manufacturer. That’s it. You can handle some thousand servers that way with only a few people.

Running applications isn’t standardized that way. One application requires a Windows Server, other run because of their history only on big iron. One vendor offers performance guarantees only for linux systems, and other vendors don’t care about the platform as long as they have a Websphere Application Server as base. Some applications are designed to run centralized, other applications can be clustered. Some have good logging and messages you can use for diagnosis, others don’t have that and error causes must be detected with system tools like truss or strace.
So applications are highly non-standardized and often need special skill and knowledge in order to operate them. Automatisation is a very hard job here, and there must be support by management to get every part of the organisation in the right direction.

(As a side note: In my former life before I joined Day I worked in a large IT operation organisation where every application was somehow non-standard; some less, but also some completly out of every order. IT tried its best to create some kind of standardization, but the busineses often didn’t care that much about it; also developers didn’t knew much about IT operations, so “but it works on my machine!!” and “Just open the firewall, so these 2 components can talk to each other” was often heard in early project stages.)

These applications also need completly different kinds of monitoring. The implementation for SAP monitoring looks different than the application monitoring for a web application. The actions the take in case of problems probably differ even more; and when it comes to investigate on errors the webapplication administrator cannot do anything on the SAP system. And vice-versa.

So it’s advisable to separate the monitoring into 2 parts: The basic system monitoring and the application monitoring.

The system monitoring part can be done by one team for all servers. The application monitoring is too complex and too different, the actions sometime require so often special knowhow, that it must be adjustable to the needs of each application and application administrators.

As a final conclusion: Everytime a computer system is setup, put it into the basic system monitoring. So failing disks can get replaced.
And when the application administrator deploys the application on it, the special monitoring stuff is installed then.
Just because the needs and skills, which it takes to react on monitored issues, are very different.

Disk usage

Providing enough free disk space is one of the most urgent task for every system administrator. Applications often behave strange when the disks runs out of free space and sometimes data gets corrupt if the application is badly written.

Under Unix the 2 tools to determine the usage of the disk are “du” (disk usage) and “df” (disk free). With “du” you can determine the amount of space a certain directory (with the files and subdirectories in it) consume. “df” shows on a global level the amount of used and free disk space per partition.

Given the case, that you give the same directory (which is also a mountpoint) to both “du” and “df” as parameters. This directory contains a full CQ application with content and versions. You will probably get different results. When we did it, “df” showed about 570 gigabyte used disk space, but “du” claimed, that only 480 gigabyte are used. We checked for hidden directories, open files, snapshots and other things, but the difference of about 90 gigabyte remained.

This phenomenon can be explained quite easy. “du” accumulates the size of files. So if a file has 120 bytes in size, it adds 120 to the sum. “df” behaves differently, it counts block-wise, which are the smallest allocation unit of a unix filesystem (today most blocks are 512 bytes large by default). Because the only one file per block is possible, the 120-byte file uses a full block, leaving 392 bytes unused in that block.

Usually this behaviour is not apparant, because the number of files is usually rather small (a few to some ten thousand) and they are large, so the unused parts are at max 1 percent of the whole file size. But if you have a CQ contentbus with several hundert thousands of files (content + versions) with a lot of small files, this part can grow to a level, where you’d ask your system administrator, where the storage is gone.

So dear system administrator, there’s no need to move your private backup off the server, just tell the business, that their unique content structure needs a lot of additional disk space. 🙂

Visualize your requests

In the last year, customers often complained about our bad performance. We had just fixed a small memory leak (which crashed our publishing instances about every hour or so), so we were quite interested in getting reliable data to confirm or deny their anger. That time I thought that we need to have a possibility to get a quick overview of the performance of our CQ instances. One look to see “Ok, it must be the network, our systems perform great!”

So I dug out my perl knowhow and wrote a little script which parses through a request.log and prints out data which which is understood by gnuplot. And gnuplot draws then some nice graphs of it. It displays the number of requests per minute and also the average request duration for these requests.

request-graph-all(Click on the image for a larger version.)

These images proved themselves as pretty useful, because you show them to your manager (“Look, the average response went down from 800 miliseconds to 600 although the number of requests went up by 30%.”) and they help you in daily bussiness, because you can spot problems quite well. When at a certain time the response times go up, you better had a look at the system and find the reason for it.

request-graph-html-ukBecause this scripts is quite fast (it parses 300 megabytes of request.log in about 15 seconds on a fast Opteron-based machine), we usually render these images online and integrate the resulting images in a small web application (no CQ but a small hacked up PHP script). For some more interactivity I added the possibility to display only the requests which matches a certain string  (click on the image to view a larger version). So it’s very easy to answer questions such “Is the performance of my landing page that bad as customer report?”

You can download this little perl script here. Run it with “–help” first and it will display a little help screen. Give a number of request.log files as parameter to it, pipe the output directly into gnuplot (I tested with version 4.0, but will probably also work with newer versions) and it will output a png file. Adjust the scripts to your needs and contribute back, I released it under GPL version 2.

(For the hackers: Some things can probably be performed better and I also have some new functionality already prepared in it, but not active. Patches are welcome :-))