
In the last releases AEM has been greatly enhanced to provide information which are suitable for health detection. Especially Oak provides a huge amout of MBeans which can be monitored. But sometimes they are a bit hard to understand. Based on some ongoing activities I digged through the “Oak Repository statistics” MBean and found it quite useful, even for some basic understanding and analysis.
I did this analysis and the screenshot on AEM 6.5, but this MBean is present at least since AEM 6.1 (probably even 6.0) and its content hasn’t changed much.
When you access this MBean the top of the page looks like this (this instance has just started):
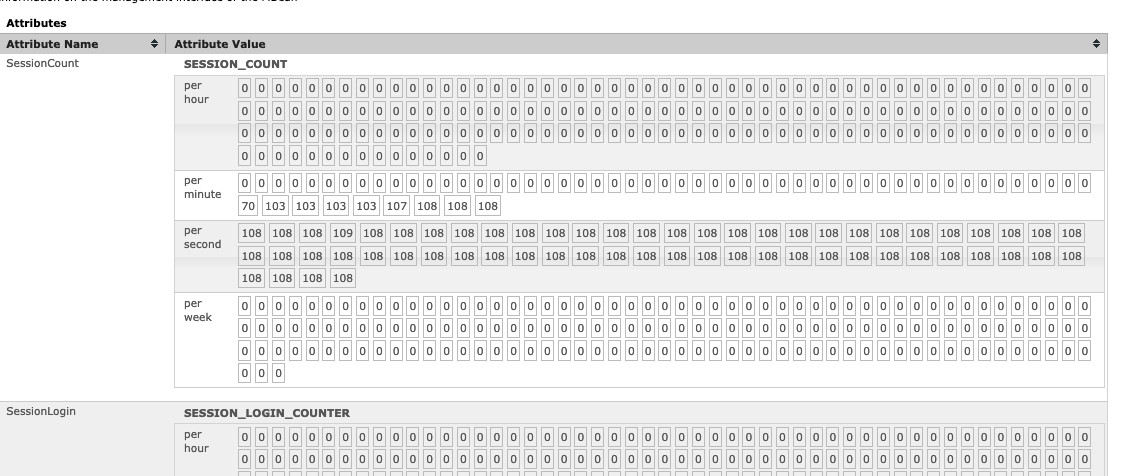
There are a number of values collected, and presented for a number of times:
- per second: The raw value in each second for the last minute.
- per minute: The aggregated value on a minute basis for the last hour
- per hour: The aggregated value on a hourly basis for the last day
- per day: the aggregated value on a daily basis
The aggregation differs based on the type of the metric:
- Gauge: This is a simple value, which is not further processed. When values of types must be aggregated, an average is calculated.
- Counter: This a number, which can be accumulated. When values of type counter must be aggregated, they are summed up.
| Attribute Name | Type | Description |
|---|---|---|
| SessionCount | Gauge | The number of JCR sessions, which are currently open |
| SessionLogin | Gauge | The number of sessions opened within that time |
| SessionReadCount | Counter | The number of read operations in the JCR (over all sessions) |
| SessionReadDuration | Gauge | The total time spent in read operations (nanoseconds) |
| SessionReadAverage | Gauge | the average duration for read operations (SessionReadDuration divided by the number of reads) |
| SessionWriteCount | Counter | The number of write operations in the JCR (over all sessions). Be aware that session.refresh() is also counted as write operation! |
| SessionWriteDuration | Gauge | Total time spent writing to sessions in nanoseconds |
| SessionWriteAverage | Gauge | the average duration for write operations (SessionWriteDuration divided by the number of writes) |
| QueryCount | Counter | The number of JCR queries executed |
| QueryDuration | Gauge | The total time spent in JCR query operations (miliseconds) |
| QueryAverage | Gauge | the average duration for queries (QueryDuration divided by the number of writes) |
| ObservationEventCount | Counter | The number of observation events delivered to all listeners |
| ObservationEventDuration | Gauge | The total time spent processing events by all observation listeners in nanoseconds |
| ObservationEventAverage | Gauge | the average duration spent processing observation events (ObservationEventDuration divided by the number of events) |
| ObservationQueueMaxLength | Gauge | The maximum length of the JCR Observation Queue; in newer Oak versions this queue does no longer exist, and then the value is -1 |
This measurement is done to limit the amount of data which needs to be stored. And this data is stored within the JVM inside the Oak bundles; that means that any restart of the JVM or restart of the Oak bundles will reset these values. If you want to persist these values you need to read them via JMX and store them.
Ok, what can you do with all this data? Well, it can help you to answer many questions. For example you can find out very easy, if you have a session leak.Because then numbers ion the SessionCount attribute always increase over time. It’s also interesting to find out what is happening within your system when it’s completely idle. Are there repository writes which you are not expecting? Queries every few seconds?
If you are investigating performance issues, or if you want to avoid them, you should have a look into this MBean.
Update: Fixed the only link in this post. Thanks Oswald for reporting!

You must be logged in to post a comment.