This is post 3 in my series about Performance Test Modelling. See the first post for an overview of this topic.
In the previous 2 posts I discussed the importance of having a clearly defined model of the performance tests, and that a good definition the load factors (typically measured by “concurrent users”) is required to build a realistic test.
In this post I cover the influence of the test system and test data on the performance test and its result, and why you should spend effort to create a test with a realistic set of data/content. In this post we will do a few thought experiments, and to judge the results of each experiment, we will use the cache-hit ratio of a CDN as a proxy metric.
Let’s design a performance test for a very simple site: It just consists of 1 page, 5 images and 1 CSS and 1 JS file; 8 files in total. Plus there is a CDN for it. So let’s assume that we have to test with 100, 500 and 1000 concurrent users. What’s the test result you expect?
Well, easy. You will get the same test result for all tests irrespective of the level of concurrency; mostly because after the first requests a files will be delivered from the CDN. That means no matter with what concurrency we test, the files are delivered from the CDN, for which we assume it will always deliver very fast. We do not test our system, but rather the CDN, because the cache hit ratio is quite close to 100%.

So what’s the reason why we do this test at all, knowing that the tests just validate the performance promises of the CDN vendor? There is no reason for it. The only reason why we would ever execute such a test is that on test design we did not pay attention to the data which we use to test. And someone decided that these 7 files are enough for satisfy the constraints of the performance test. But the results do not tell us anything about the performance of the site, which in production will consists of tens of thousands of distinct files.
So let’s us do a second thought experiment, this time we test with 100’000 files, 100 concurrent users requesting these files randomly, and a CDN which is configured to cache files for 8 hours (TTL=8h). With regard to to chache-hit-ratio, what is the expectation?

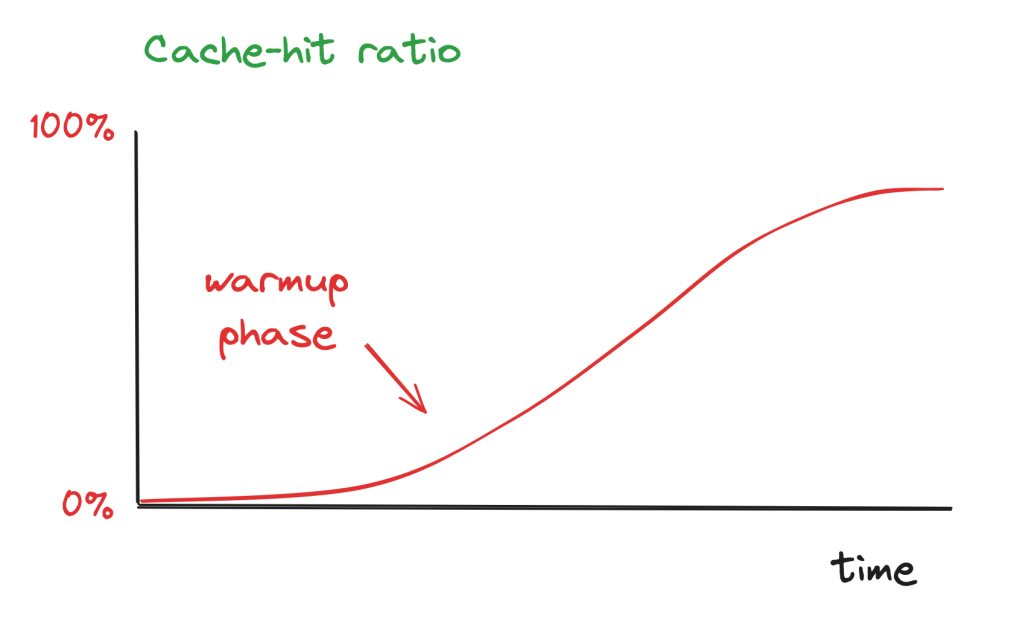
We expect that the cache-hit ratio starts low for quite some time, this is the cache-warming phase. And then it starts to increase, but it will never hit 100%, as after some time cache entries will expire on the cache and start produce cache-misses. This is a much better model of reality, but it still has a major flaw: In reality, requests are not randomly distributed, but normally there are hotspots.
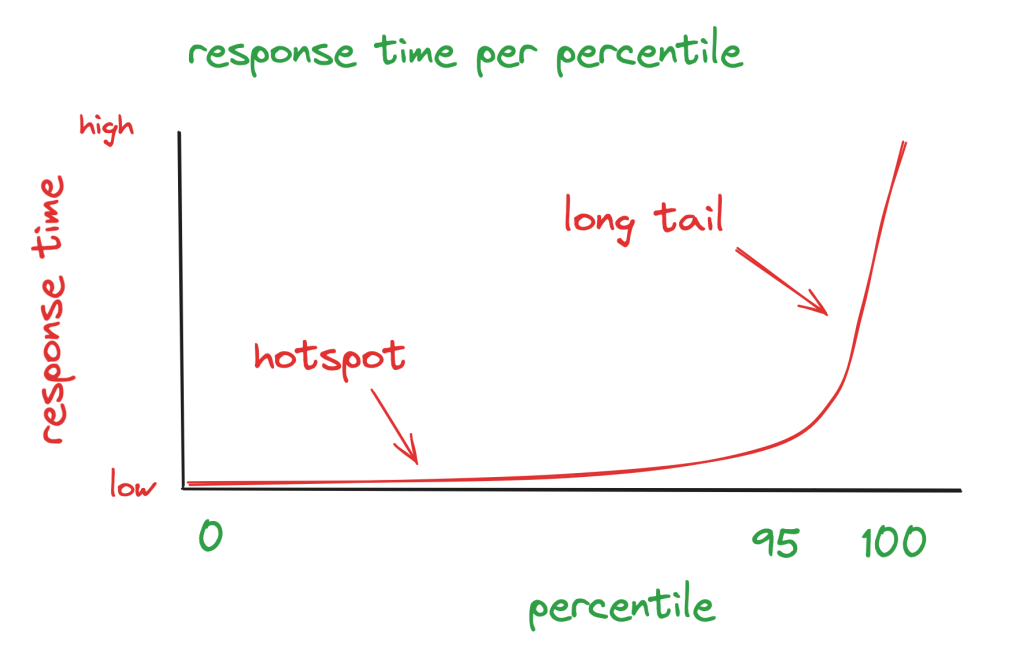
A hotspot consists of files, which are requested much more often than average. Normally these are homepages or other landing pages, plus other pages which users normally are directed to. This set of files is normally quite small compared to the total amount of files (in the range of 1-2%), but they make up 40-60% of the overall requests, and you can easily assume a Pareto distribution (the famous 80/20 rule), that 20% of the files were responsible for 80% of the requests. That means we have a hotspot and a long-tail distribution of the requests.

If we modify the same performance test to take that distribution into account, we end up with a higher cache-hit ratio, because now the hotspot can be delivered mostly from the CDN. But on the long-tail we will have more cache-misses, because they are requested that rarely, so they can expire on the CDN without being requested again. But in total the cache-hit ratio will be better than with the random distribution, especially on the often-requested pages (which are normally the ones we care about most).

Let’s translate this into a graph which displays the response time.

This test is now quite realistic, and if we only focus on the 95 percentile (p95; that means if we take 100 requests, 95 of them are faster than this) the result would meet the criteria; but beyond that the response time is getting higher, because there are a lot of cache misses.
This level of realism in the test results comes with a price: Also the performance test model and the test preparation and execution are much more complicated now.
And till now we only considered users, but what happens when we add random internet noise and the search engines (the unmodelled users from the first part of this series) into the scenario? These will add more (relative) weight to the long-tail, because these requests do not necessarily follow the usual hotspots, but we have to assume a more random distribution for these.
That means that then the cache-hit ratio will be lower again, as there will be much more cache-misses now; and of course this will also increase the response time of the p95. And: it will complicate the model even further.
So let’s stop here. As I have outlined above, the most simple model is totally unrealistic, but making it more realistic makes the model more complex as well. And at some point the model is no longer helpful, because we cannot transform it into a test setup without too much effort (creating test data/content, complex rules to implement the random and hotspot-based requests, etc). That means especially in the case of the test data and test scenarios we need to find the right balance. The right balance between the investment we want to make into tests and how close it should mirror the reality.
I also tried to show you, how far you can get without doing any kind of performance test. Just based on some assumptions were able to build a basic understanding how the system will behave, and how some changes of the parameters will affect the result. I use this technique a lot and it helps me to quickly refine models and define the next steps or the next test iteration.
In part 4 I discuss various scenarios which you should consider in your performance test model, including some practical recommendations how to include them in your test model.
2 thoughts on “Performance tests modelling (part 3)”
Comments are closed.