
The Tar Persistence Manager (TarPM) is the default persistence mechanism in CQ. It stores all data in a filesystem and is quite good and performant.
But there are situations where you would like what actually happens in the repository:
- When your repository grows and grows
- When you suffer a huge number of JCR events
- When you do performance optimization
- When you’re just interested, what happens under the hoods
In such occasions you can use the “CRX Change history” page on the OSGI console; if you choose the “details” link to the most recent tar file, it will show you the details of each transactions: the name of the changed nodes and a timestamp.
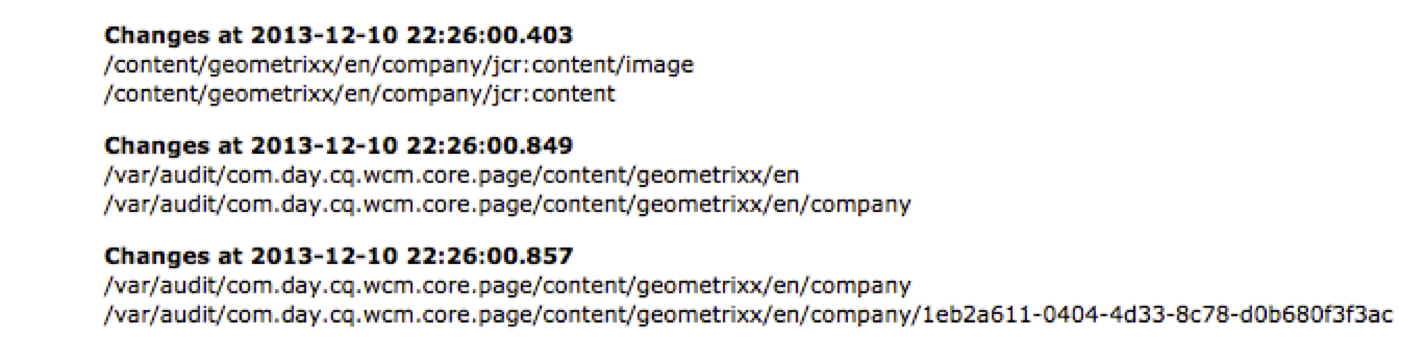
In this little screenshot you can see, that first some changes to the image node have been written; immediately afterwards the corresponding audit event has been stored in the repository.
I use this tool especially when I need to check the data which is written to the repository. Especially when multiple operations run concurrently and I want need to monitor the behavior of the some application code I don’t know very well, this screen is of huge help. I can find out, if some process really writes that much data as anticipated. Also the amount of nodes written in a single transaction shows, if batch saves are used or if the developer preferred lots of individual saves (which have a performance penalty).
And you can really check, if your overflowing JCR event queue is caused by many write operations or by slow observation listeners.
So it’s a good tool if you assume that the writes to your repository should be quicker.

You must be logged in to post a comment.